Discover your all-in-one digital freight platform
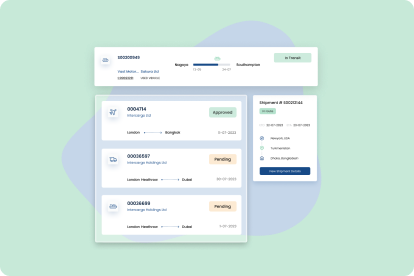
Escape the chaos of calls, faxes, and endless emails. Step into a connected world where suppliers, shippers, customs, ports, and more unite on a single platform for seamless, contextual collaboration

Let us help you 24/7 manage your supply chain needs










Being an IATA accredited agent we have access to over 149 airlines, this includes scheduled freighters and passenger aircrafts.

With our LCL service, you can ship as little or as much as you like, weekly consoles are our business and get you yours.

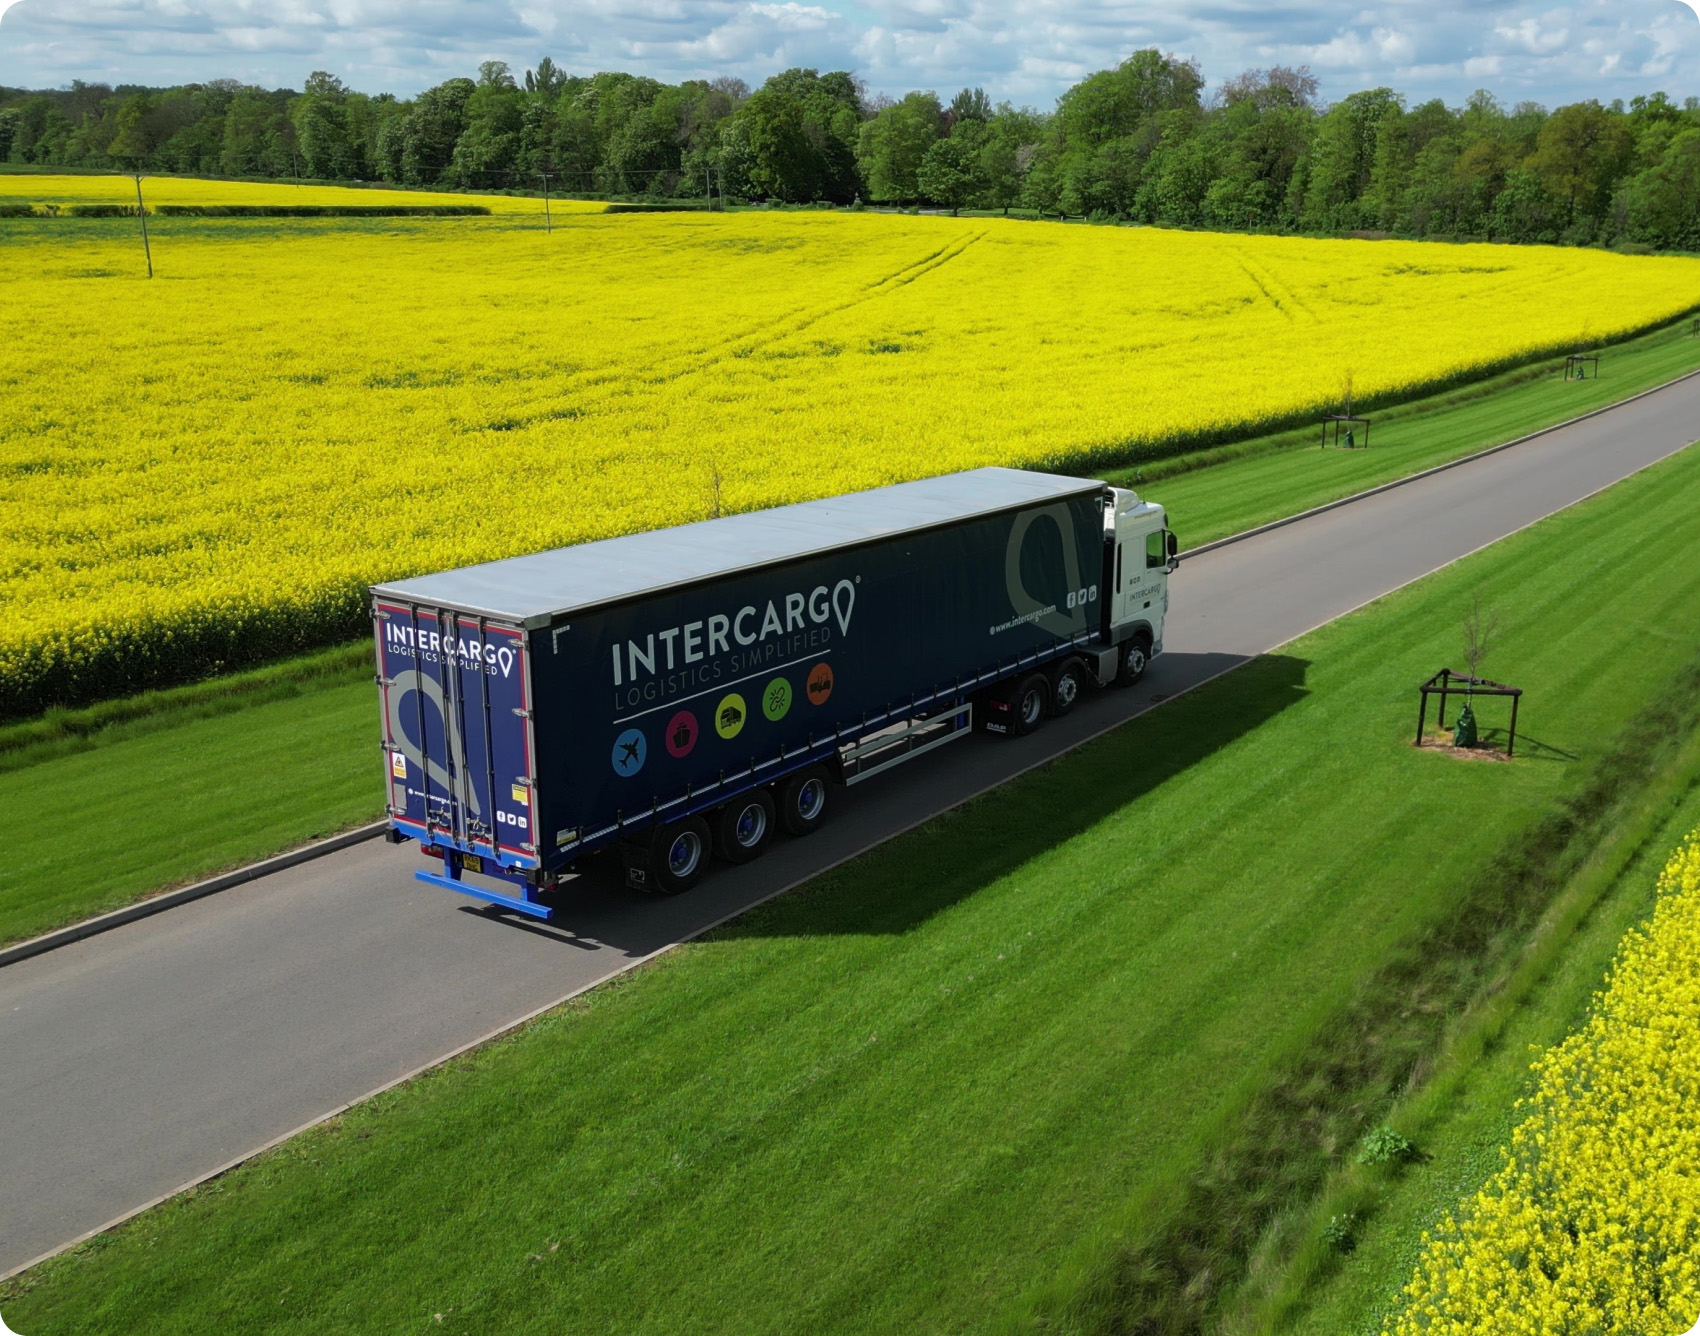
We provide comprehensive road freight services, covering both Less-Than-Truckload (LTL) and Full-Truckload (FTL) options.
To meet your requirements we have access to vehicles of all sizes from small vans to artic with 24/7 availability and live tracking.
Escape the chaos of calls, faxes, and endless emails. Step into a connected world where suppliers, shippers, customs, ports, and more unite on a single platform for seamless, contextual collaboration


Etihad Cargo flies rescued bears from Russia to Ireland
Abu Dhabi-based Etihad Cargo has flown two rescued brown bears from Russia to their new home at Wild Ireland, a wildlife sanctuary in County Donegal. Bu, a former circus bear, and Tyapa, who had been kept at a petting zoo, spent years living in what are said to have been unsuitable conditions in Dagestan, Russia. They landed in Ireland on 4 August 2026, an event that marked the successful conclusion of a five-year international rescue effort led by Killian McLaughlin, founder and director of Wild Ireland, one that involved more than 100 people in various countries. Etihad Cargo, the cargo and logistics arm of UAE flag-carrier Etihad Airways, flew the bears from Moscow to Dublin via its hub in Abu Dhabi. The carrier worked closely with Abu Dhabi Airports and Velora, its teams coordinating the specialist handling and transit arrangements required for the bears at Abu Dhabi's Zayed International Airport. Stanislas Brun, chief cargo officer at Etihad, commented: "At Etihad Cargo, we believe our global network and expertise can play a meaningful role in supporting wildlife conservation and animal welfare. "Bu and Tyapa's rescue is a powerful example of how collaboration can give animals a second chance at life." The bears were moved into their new forest habitat at Wild Ireland last month. Killian McLaughlin, founder and director of Wild Ireland, declared: "After five years of challenges, seeing Bu and Tyapa finally reach their new home is incredibly rewarding. "This rescue would not have been possible without the kindness, determination and collaboration of people across multiple countries. Together, we have given these bears the chance of a better life." Etihad Cargo's has IATA CEIV Live Animals certification, reflecting its commitment to meeting high standards in animal transportation. In another recent animal shipment, last month FedEx flew two giant pandas from China to the US aboard a Boeing 777 freighter known as the "FedEx Panda Express". The airline said that it worked with Zoo Atlanta to move six-year-old male Ping Ping and five-year-old female Fu Shuang, from Chengdu, China to Atlanta, Georgia. In August LATAM Cargo announced that it had operated a dedicated charter flight transporting eight tigers and seven lions from Buenos Aires, Argentina, to Denver, Colorado in the US, with a technical stop in Santiago, Chile. The flight was carried out following a rescue operation by animal welfare organisation Four Paws International, with the big cats being relocated to The Wild Animal Sanctuary in Keenesburg, Colorado. And, around the same time, TAAG Angola Airlines transported two adult lions from South Africa to Nigeria via Angola. The lions, weighing approximately 200 kgs each, began their journey in Johannesburg, South Africa, where they were under the care and supervision of wildlife conservation specialists.
Source: aircargonews.net
Read more
Qatar Cargo signs up with Pelicargo
Qatar Airways Cargo has become the latest carrier to place its capacity on US airfreight procurement and booking platform Pelicargo. Pelicargo said the partnership would provide freight forwarder users of Pelicargo with direct access to Qatar Airways Cargo's global network, real-time capacity and booking capabilities. The platform enables forwarders to quote, book, and manage international shipments from any US origin ZIP code, combining first-mile trucking with airfreight. "As forwarders face increasing pressure to respond faster to customer demands while managing tighter operational timelines, access to reliable global capacity has become increasingly critical," said Pelicargo. "With Qatar Airways Cargo becoming part of the platform, Pelicargo further strengthens its ability to connect forwarders with major international trade lanes through a more centralised and efficient workflow." The integration allows Qatar Airways Cargo to provide its products, services and open offer its global network to customers. Sean Angata, co-founder of Pelicargo, said: "Qatar Airways Cargo operates one of the most strategically connected networks in the world, making it one of the most important partners on our platform. "Today's freight forwarders need speed, visibility, and flexibility when securing capacity across multiple regions. This partnership will make that process even more seamless while further enhancing the overall user experience for our customers." In May, Emirates SkyCargo also placed its capacity on the platform.
Source: aircargonews.net
Read more
Kales expands into Iceland with new JV
GSSA Kales Group has expanded into the Icelandic market through a new partnership with forwarder and logistics service provider TVG-Zimsen. The Kales Iceland business is launching on the back of a contract with Air China to provide the carrier with GSSA services covering the country, including the commercial development of its cargo business in Iceland. "The establishment of Kales Iceland represents an exciting new chapter for airline representation in Iceland. By combining TVG-Zimsen's understanding of the Icelandic market with Kales' international GSSA expertise and airline network, we are creating a strong foundation for airlines looking to develop their business in Iceland," said Raffaele Manna, managing director of TVG-Zimsen. Sebastiaan Scholte, chief executive of Kales Group, added: "By combining Kales' international experience and airline network with TVG-Zimsen's local market knowledge, we have a strong foundation for developing Kales Iceland. "Our ambition is to build a professional, independent and commercially focused GSSA organisation that creates value for our airline principals and for the entire Icelandic cargo community." Kales Iceland will provide commercial and operational support to international airlines and help develop their cargo business by connecting them with freight forwarders, exporters and importers in Iceland. The Air China contract comes as the airline is preparing to commence a new service between Beijing and Keflavík via Copenhagen on 26 October, operating three times per week with Airbus A330-300 aircraft carrying both passengers and cargo. "Icelandic exporters, particularly those shipping fresh seafood and other time-sensitive products, gain a new route to reach customers in the Chinese market," said Kales Iceland in a press release. "At the same time, importers benefit from a new scheduled freight connection and greater access to goods and suppliers in China." "It is exciting to see Iceland and China becoming more closely connected. Direct air connectivity creates opportunities that go far beyond the flight itself, strengthening trade, relationships and cooperation between our two countries. We are proud that Kales Iceland can contribute to building on those opportunities," added Manna.
Source: aircargonews.net
Read more
This website uses cookies and similar technologies, (hereafter “technologies”), which enable us, for example, to determine how frequently our internet pages are visited, the number of visitors, to configure our offers for maximum convenience and efficiency and to support our marketing efforts. These technologies incorporate data transfers to third-party providers based in countries without an adequate level of data protection (e. g. United States). For further information, including the processing of data by third-party providers and the possibility of revoking your consent at any time, please see your settings under “Consent Preferences” and our Privacy Notice.